Features

Three jobs: find the money, understand the money, protect the money.

Not a module tour — a list of business questions BlendBadger answers, with the screenshot to prove each one. Anything not shipped yet says so, plainly.

Chapter 1

Find the money

The profit you already earned, hiding under fees, refunds and averages.

Contribution ladder Live

"What did I actually make on this product?"

One ladder from revenue to net profit — discounts, refunds, marketplace fees, payment fees, COGS, fulfillment, ad spend and overhead — per SKU, product, channel, country and day. Click any number and see the rule that made it.

Decision you can make today: reprice, renegotiate or retire every SKU that ends below the line.

Under the hood: order lines are normalized, mapped to canonical SKUs, and walked down the ladder one deduction at a time.

Replaces: 3 spreadsheets and a Sunday.
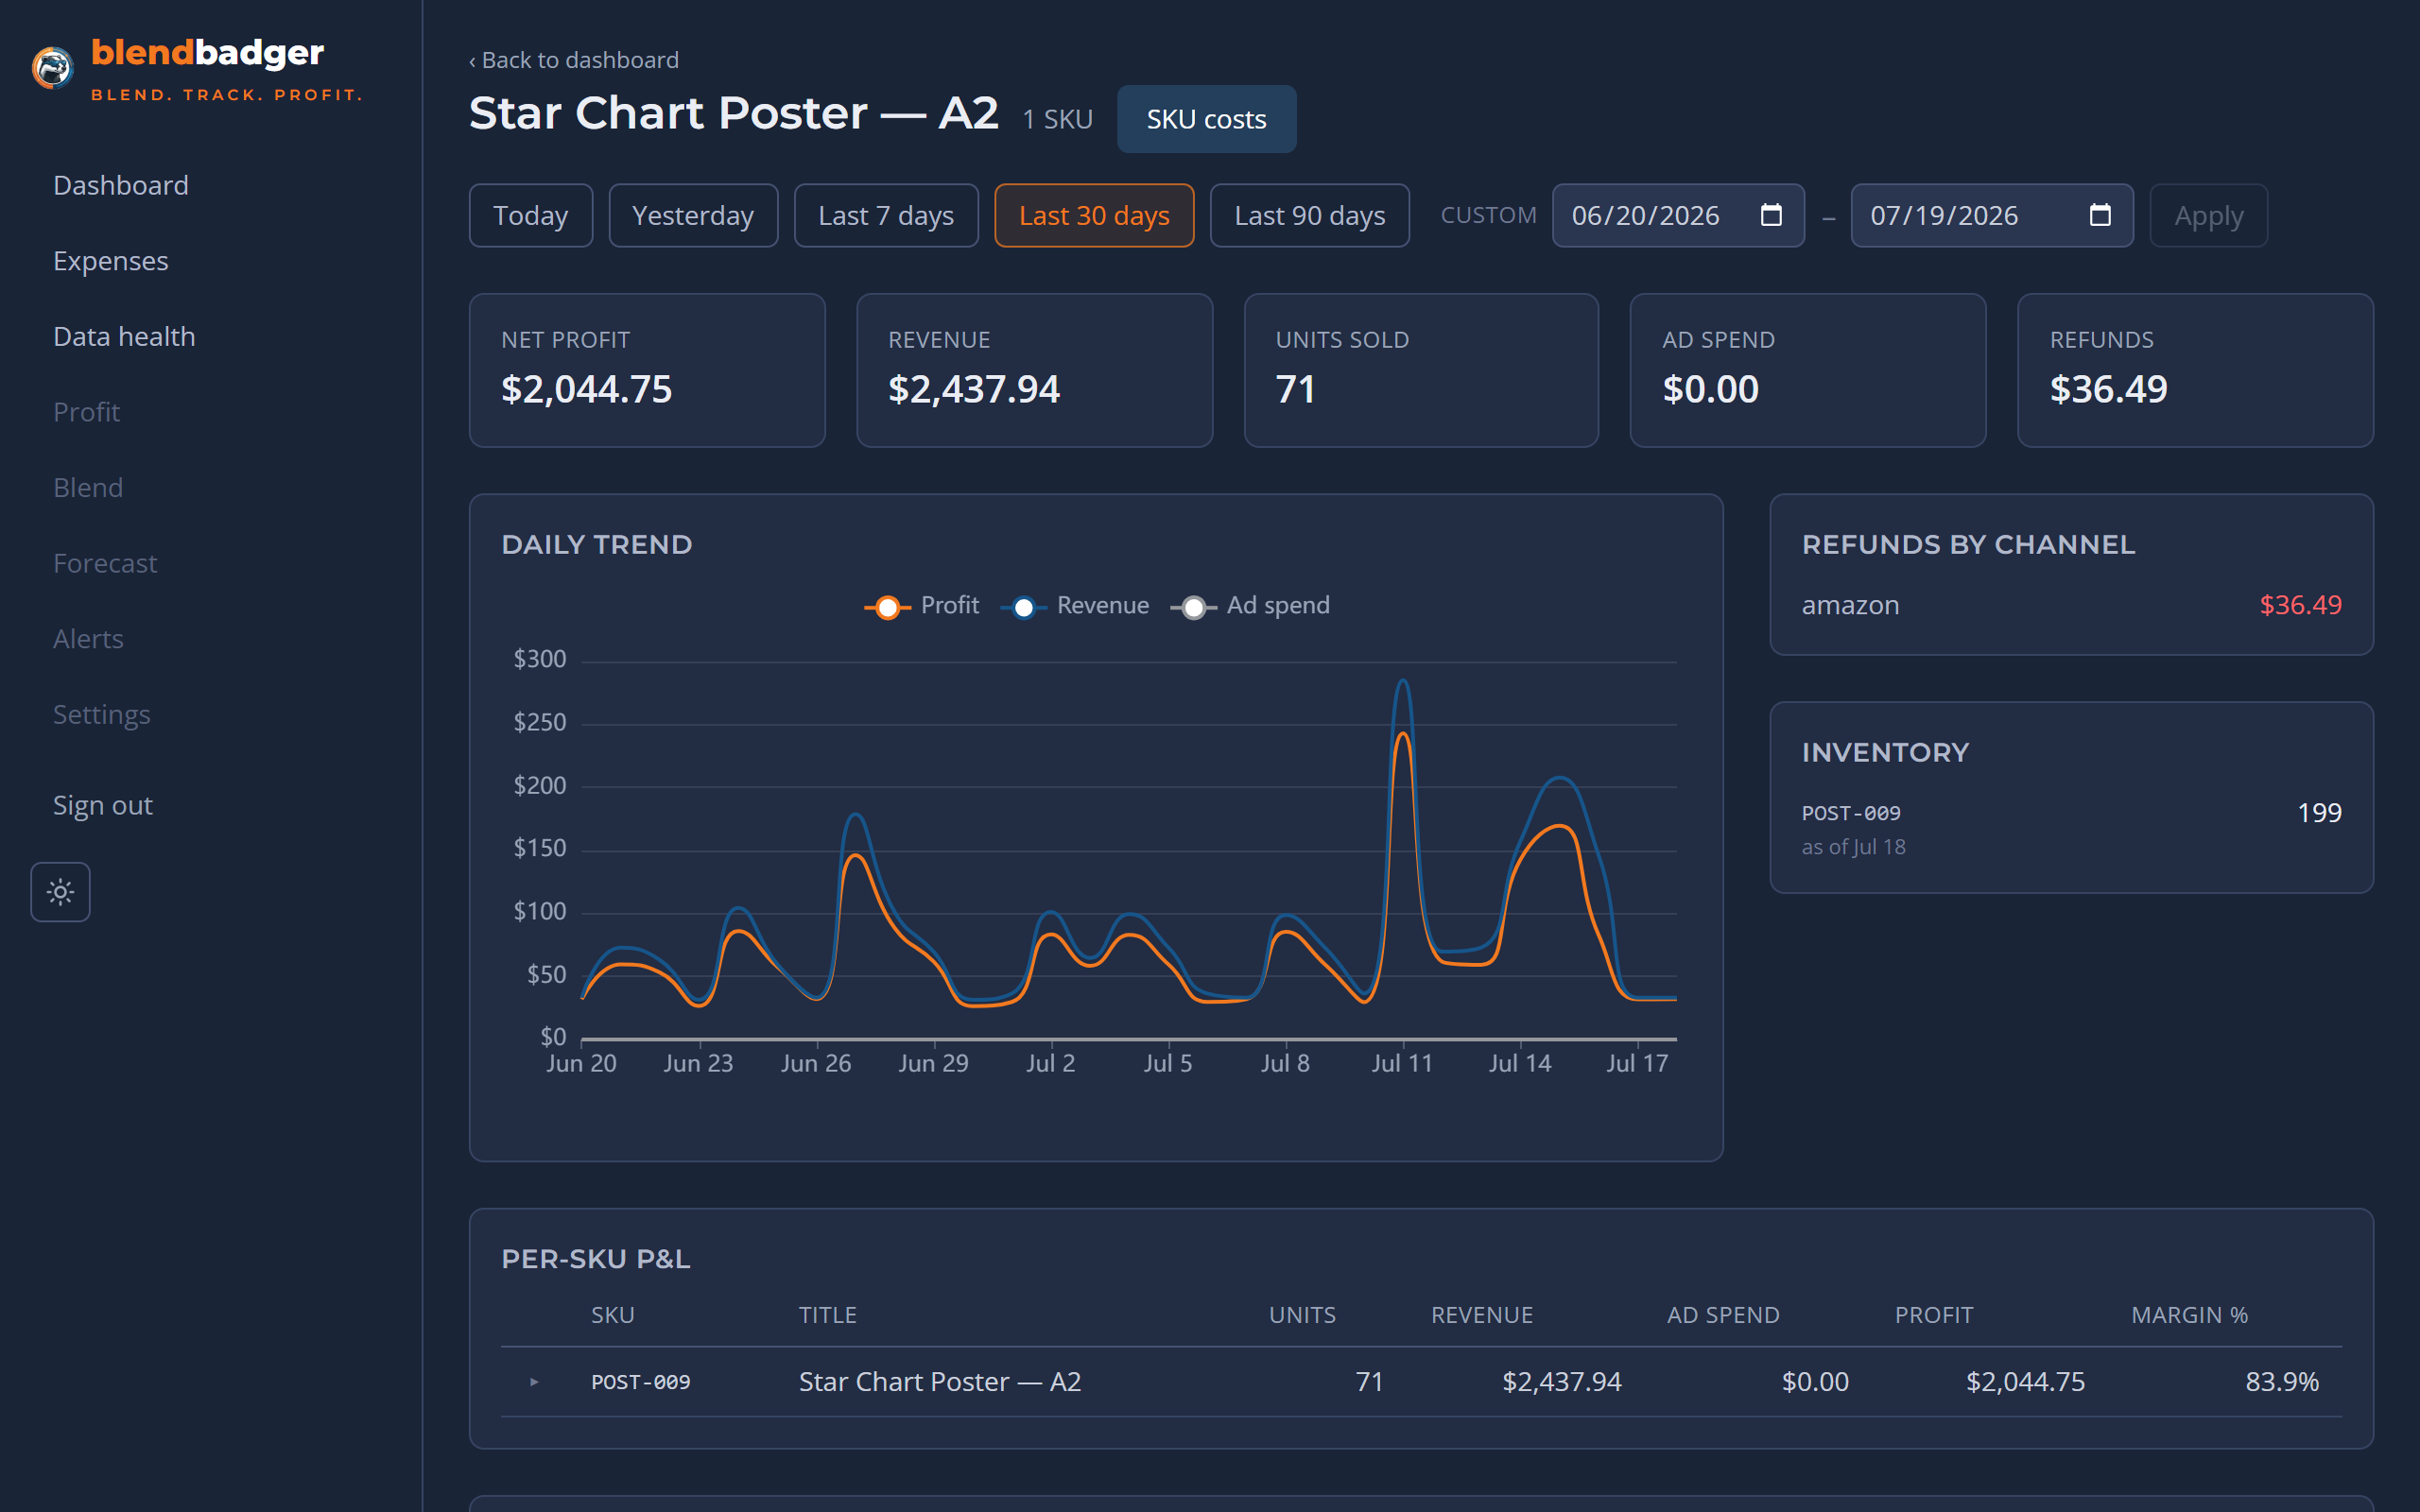
BlendBadger product deep-dive with the full contribution ladder from revenue to net profit
The contribution ladder for one product — live demo data.

Every rung labeled measured or modeled, so you know how solid the number is.
Payout reconciliation Live for Shopify

"Can I trust this number?"

If it doesn't reconcile to your payout, it's a hypothesis. BlendBadger checks the ledger against the deposits Shopify actually made — orders, fees, refunds and chargebacks traced line by line until the gap is zero.

Decision you can make today: stop cross-checking dashboards against your bank statement by hand.

Under the hood: payout line items from the platform are matched to ledger entries; anything unexplained is surfaced, never smoothed over.

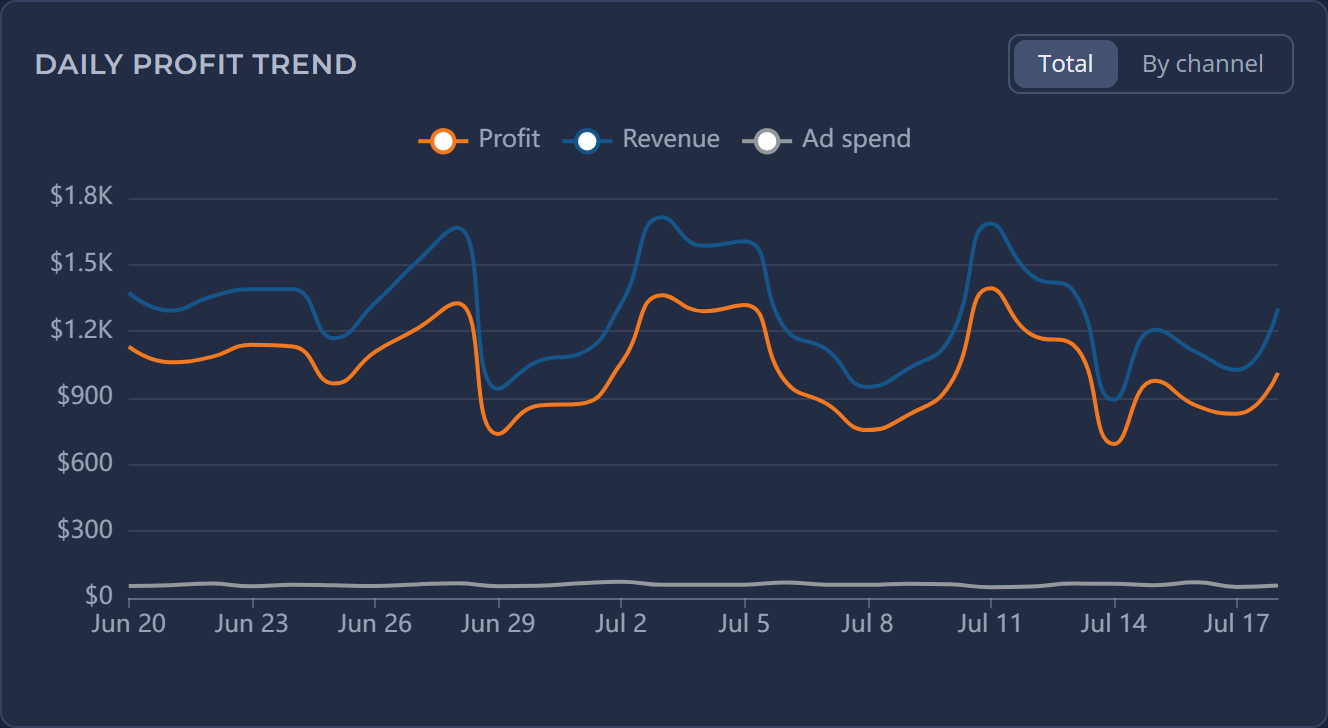
BlendBadger profit trend over time
Profit trend, reconciled — live demo data.

The trend line is net profit — the line your bank account would draw, not the one your ads manager draws.

Leak detection Live

"Where is margin leaking?"

Loss-making SKUs that look like winners. Fees that crept up while you were sleeping. Refund-heavy products reversing "sold" into "sorry". Shipping priced for a lighter parcel than the one you ship. BlendBadger ranks the catalog by cash drain, not revenue ego.

Decision you can make today: fix the top three drains. If one of them is worth $50/month, the tool paid for itself.

Replaces: the uneasy feeling that something's off.

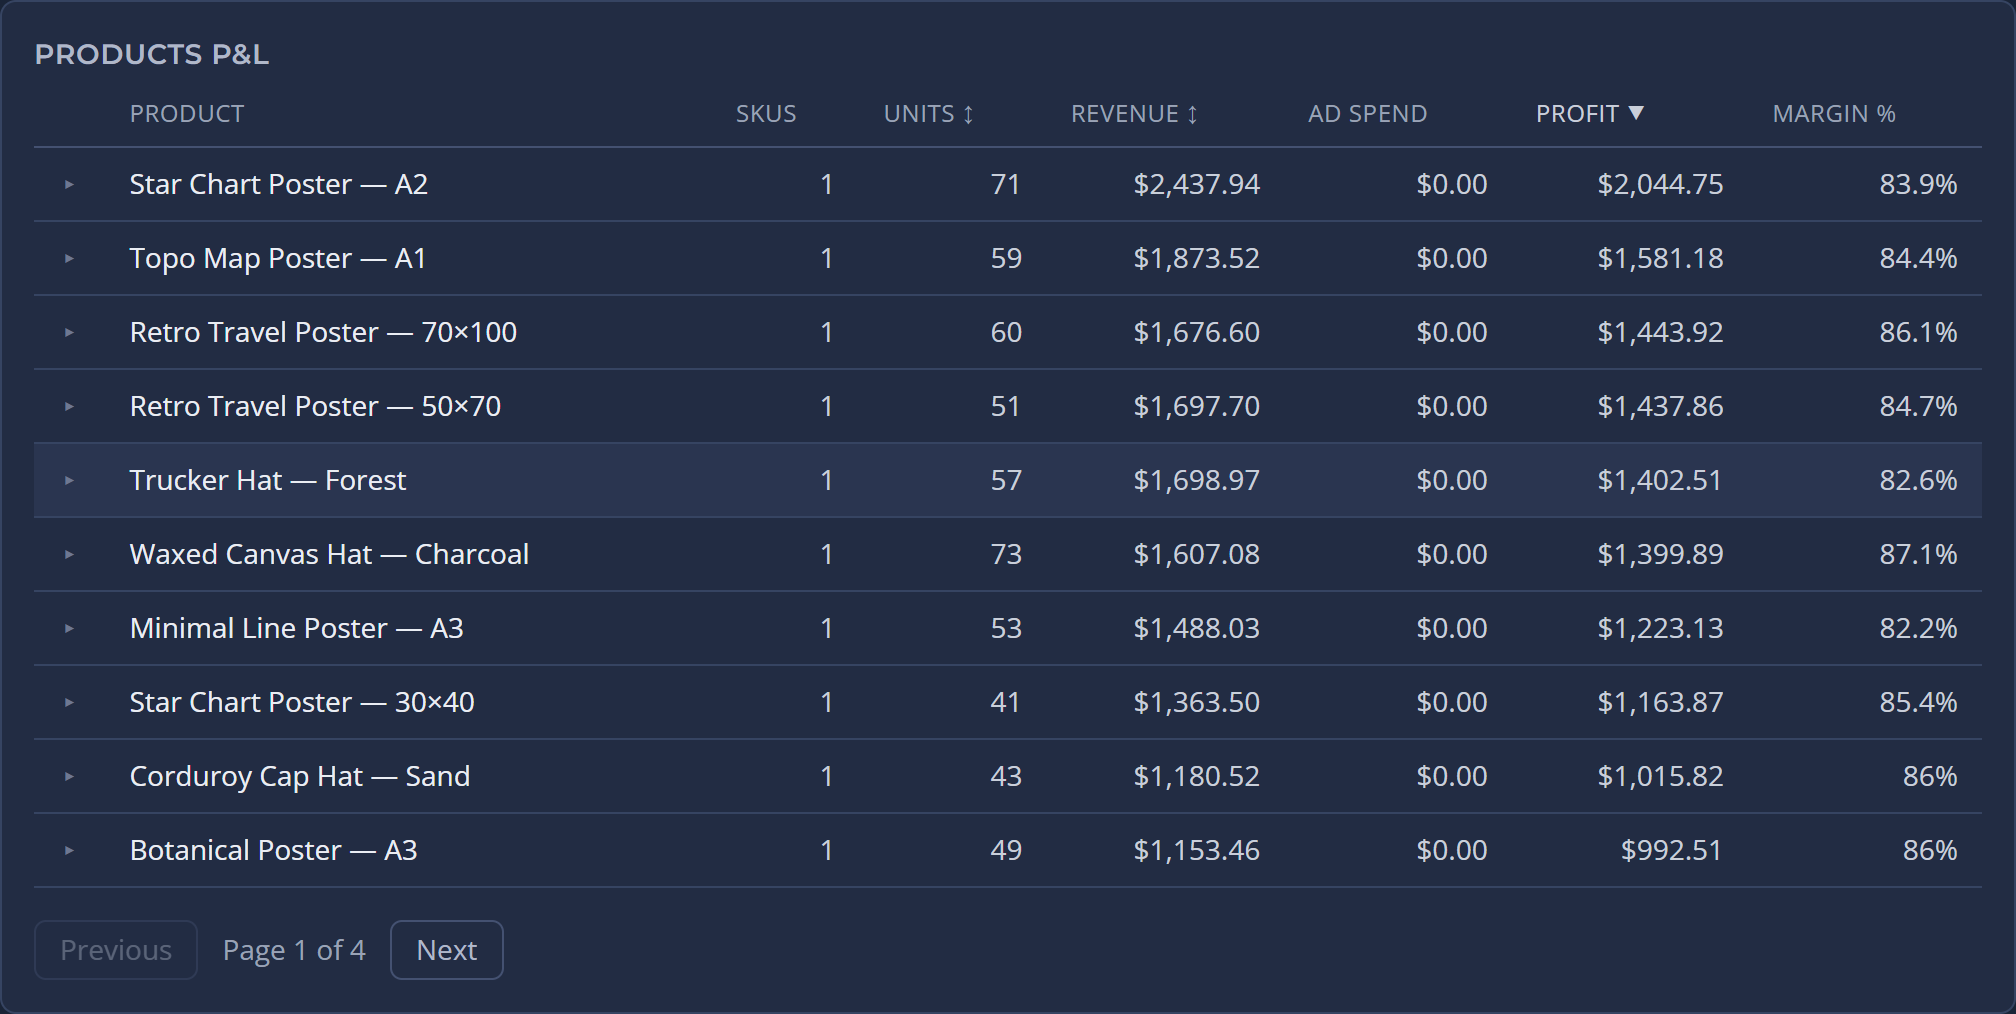
BlendBadger SKU P&L table ranking products by real profit
The SKU P&L table — live demo data.

Sort by real profit and watch the revenue "winners" reshuffle.

Chapter 2

Understand the money

The category-defining part — and we'll say it plainly: this is what BlendBadger is built for, shipping as ad channels connect.

The Blend Engine Coming

"Which ads actually created profitable demand?"

Your ad platforms are grading their own homework: Google claims the sale, Meta claims the same sale, Amazon counts it too. The Blend Engine is built to compute your actual blended ROAS per channel, per SKU — from your ledger, not their press releases.

Modeled channel interaction will always be clearly separated from directly measured sales. We'll never tell you a guess is a fact.

4.2×
Google claims
3.8×
Meta claims
2.1×
Actual blended

The gap is money you were about to reinvest in the wrong channel.

Channel interaction Coming

"How do my channels interact?"

Halo — ads on one channel lifting sales on another. Cannibalization — a marketplace quietly eating your store's orders. Stockout substitution — one listing's outage boosting its sibling. Your channels talk to each other; BlendBadger is built to listen.

Decision it's built to unlock: shift budget between channels based on what the blend earns, not what each platform claims.

Channel interaction

Meta ads → +12% marketplace sales on the same SKU (halo)
Marketplace listing → −9% store sales (cannibalization)
Store stockout → orders shift to the eBay listing (substitution)

The effects the Blend Engine is built to separate.

Chapter 3

Protect the money

Keep the profit you found — from stockouts, bad data and finance admin.

Stockout cost Coming

"What will a stockout really cost me?"

Running out of stock isn't a $0 day — it's lost sales, ad spend still burning against a listing that can't convert, and a ranking that slides and doesn't fully climb back. BlendBadger is built to forecast the runout and price it in dollars of profit before it happens.

Decision it's built to unlock: reorder by profit at risk, not by gut feel.

30 days, one SKU

in stock out of stock — profit lost slow recovery

Data Health Live

"Is my data sabotaging my decisions?"

Duplicate SKUs, missing COGS, unmapped fees: garbage in, confident-looking garbage out. Data Health finds the gaps, walks you through fixing them, and labels every number measured or modeled so you always know what you're standing on.

Decision you can make today: fix the SKUs missing COGS before you trust any margin number — ours included.

Data Health check

Catalog synced — SKUs mapped across channels
!14 SKUs missing COGSfix in 2 min
!2 duplicate SKUs detectedmerge suggested
Payouts reconciled through last deposit

Cost capture Live

"Can I get costs in without doing finance admin?"

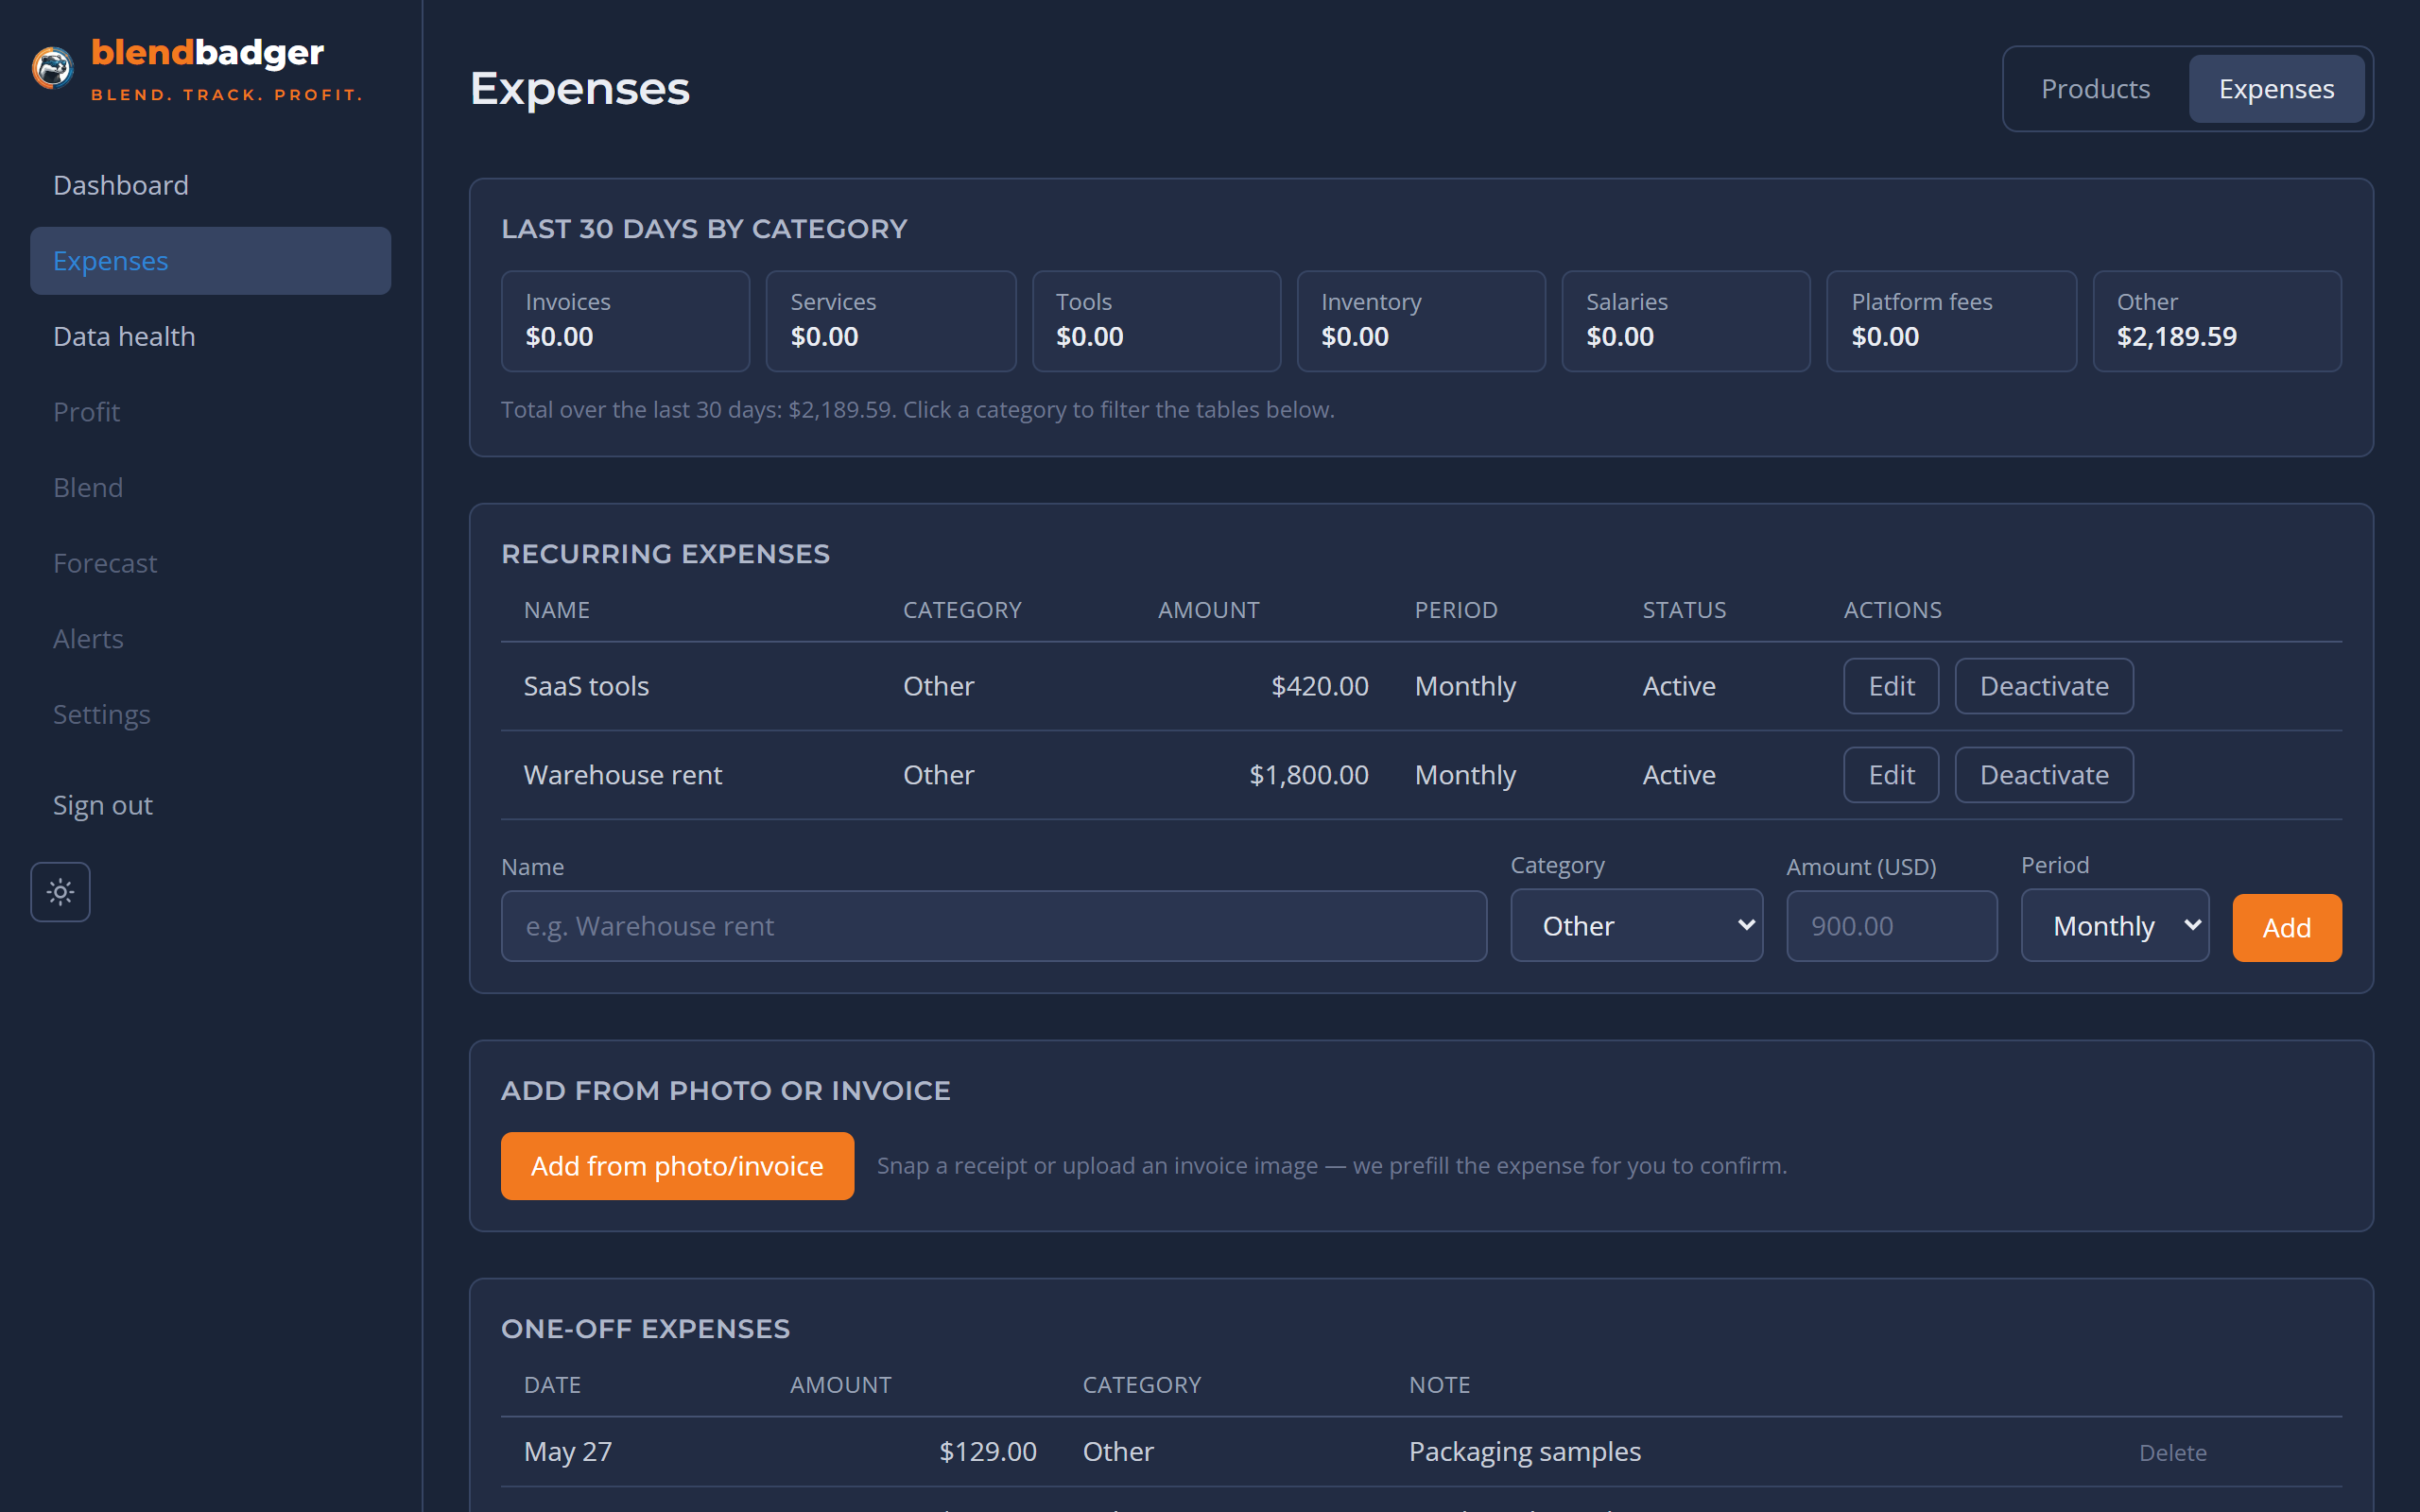
Photo an invoice — done. The amount and category are extracted, you confirm, and overhead flows into the ladder by allocation rules you control. Recurring rules handle rent and SaaS; multi-currency keeps every cost in its original currency and normalizes to yours; the app speaks 8 languages.

Replaces: the shoebox of receipts and the guilt attached to it.

BlendBadger expenses view with recurring rules, one-off costs and category allocation
Expenses — live demo data.

Overhead allocated to SKUs by rules you can inspect — no invisible averages.

Find your first leak this week.

Connect in about a minute and get a one-page report of your three biggest leaks, in dollars.